
April 6, 2026
Key Insights
- CPI is an older metric that is useful for comparing historical economic conditions.
- PCI casts a wider net and is more quickly to adjust to adjust to evolving consumer behavior.
- Both metrics ultimately provide useful insight into the cost of goods and services.
Latest from EdgeRock
Questions? Talk to our team.
Find out how truly custom, independent planning can impact your portfolio.
Start a Conversation
CPI vs. PCE: Different rulers, same objective
By Ryan Murphy
August 21, 2024 |
By Ryan Murphy
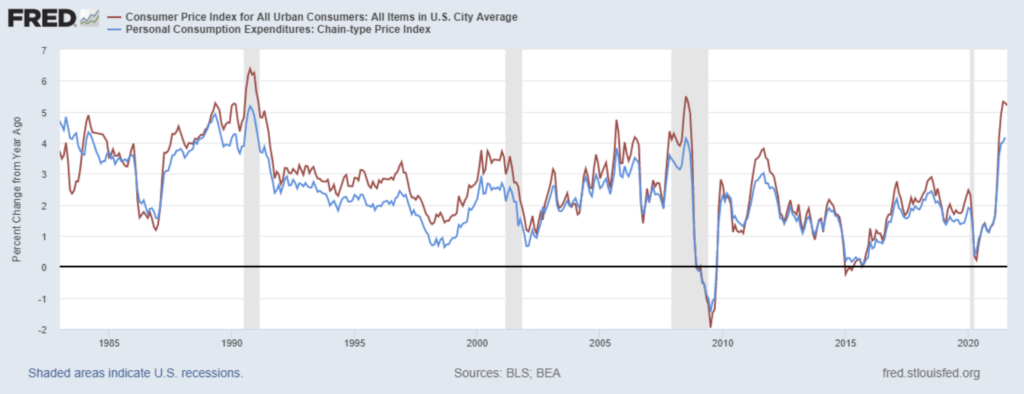
We we talk about inflation, we refer to two common metrics, CPI and PCI. Which is more useful for measuring the state of the economy?

With everyone closely watching the Federal Reserve as it contemplates cutting rates in September, the way we measure inflation in our economy continues to be examined.
It’s not easy to decipher this data, nor can we ever be certain about what it’s telling us. We also commonly reference not one, but two different measurements of inflation: Consumer Price Index (CPI) and Personal Consumption Expenditures (PCE), which adds to everyone’s general confusion.
Both metrics differ in their calculation methods, coverage, and usage, and are constantly scrutinized by both economists and the financial media alike. So let’s take a moment to discuss the differences and merits of each—and why it doesn’t necessarily benefit us to choose between the two.
CPI: Tried and true? Or too slow?
The CPI measures the average change in prices paid by urban consumers for a fixed basket of goods and services. Meaning: It focuses on out-of-pocket expenditures and is based on what households are buying.
The U.S. Bureau of Labor and Statistics first published CPI all the way back in 1921, using data it had collected dating back to 1913. It used (and still uses) fixed weights based on a survey of consumer spending patterns. This means that the basket of goods and services it tracks is adjusted infrequently (every two years or so), which might not always reflect current consumer behavior.
CPI is calculated using the Laspeyres formula, which compares the cost of the current basket of goods and services to the cost of the same basket in a base period. This can lead to an overestimation of inflation because it too slowly accounts for substitution (when consumers switch to cheaper alternatives).
Data for the CPI, like a lot of government data, is collected directly from consumers through surveys, focusing on out-of-pocket expenses.
PCE: An inflation metric for the new millennia
Personal Consumption Expenditures has been tracked by economists since 1959, but it’s only been the FED’s preferred measure of inflation since 2000.
PCE has a much broader scope and is also faster to adjust to consumer behavior, which is why it is the preferred metric of the FED. It includes all goods and services consumed by households, not just those directly paid for by consumers.
An example is employer-provided healthcare, which is not directly paid for by households but is consumed by them. The PCE uses variable weights that adjust more frequently, reflecting changes in consumer behavior and spending patterns.
PCE uses a Fisher-Ideal index, which considers changes in both prices and quantities consumed. This accounts for substitution effects, leading to potentially lower and more accurate measures of inflation. PCE data comes from a variety of sources, including business surveys and administrative records, providing a more comprehensive view of consumption.
Revisions are vital for better understanding trends
Another major difference between the CPI and PCE is that the CPI does not get revised after it’s released, except for annual seasonal adjustments—which are usually insignificant.
The CPI is designed to be a timely indicator of inflation, providing a snapshot of consumer prices for a given month. It emphasizes providing a consistent and reliable monthly measure and maintains a consistent methodology, minimizing the need for revisions. Any methodological changes are typically implemented in a way that doesn’t affect previously released data.
The Personal Consumption Expenditures index (PCE), on the other hand, is subject to regular revisions—both monthly and annually, with more comprehensive revisions implemented every five years or so.
These monthly revisions generally occur due to more detailed information available subsequent to the initial release of the data. This can include lagging inputs from sources like business surveys, retail sales, and government reports that were not available at the time of the initial estimate. Annual revisions and more comprehensive revisions occur when the BLS incorporates data compiled over a longer timeline (i.e. the U.S. Census), makes changes in its methodology, and adopts new data sources it believes represent the conditions of the economy.
Both CPI and PCE will switch out goods for new goods when consumers stop consuming them. A common example is when families start eating more hamburgers because steak becomes too expensive. The result is that CPI and PCE will revise lower and no longer reflect the fact that steak prices remain high.
The revisions are important because they can be material. A recent study concluded that from 2001 to 2018, 90% of the differences between year-over-year initial core PCE, and revised core PCE, ranged from -0.5% to +0.5%.
More recently, month-over-month revised PCE data was revised upward in April and in May. The updated data resulted in new monthly readings adjusting 0.1% lower and 0.1% higher in relation to CPI during the same time periods.
Both metrics have their critics
Tracking inflation and its effect on individuals and families is really complex. The FED doesn’t have an easy job when it comes to managing its dual mandate of maximum employment and price stability.
There are plenty of voices on television—economists and pundits alike—who will criticize how inflation is tracked, and maybe even support one metric over another. We believe both are important and regularly review them.
When it comes to financial planning and investment planning at EdgeRock, we generally set aside the intellectual debates about inflation and instead deliberately overestimate inflation in our long-term assumptions.
We design strategies using a rate of inflation historically higher than the FED’s target—usually something like 3%. Inflation rates will differ for every individual situation based on one’s purchasing needs, but we believe it’s best practice to plan for less-than-ideal economic conditions.
Just in case.
Related Posts

Why investors shouldn’t hide from market corrections
April 7, 2025Don’t fear the Buffett indicator
April 3, 2024Private credit is under scrutiny. Is it warranted?
April 6, 2026
The lifetime value of Roth conversions
August 26, 2024


About the Author
As Director of Marketing, Ryan helps introduce EdgeRock to Colorado families and business owners. In a previous life, he reported on sports and culture for SBNation and The Denver Post.
Related Posts
The Sahm Rule trigger might not indicate recession
August 6, 2024


Read more Insights