
April 6, 2026
Key Insights
- Single indicators generally aren’t useful predictors of the economy.
- Today’s economic conditions require unique considerations that may not apply to past market cycles.
- Stock prices may no longer be an obvious buy, but they’re not an obviously sell either.
Latest from EdgeRock
Questions? Talk to our team.
Find out how truly custom, independent planning can impact your portfolio.
Start a Conversation
Don’t fear the Buffett indicator
By Rob Foss
April 3, 2024 |
By Rob Foss
Warren Buffet's famous metric could be signaling troubles ahead—but it also might not. Investors need to weigh more factors.

With the S&P 500 up more than 28 percent since the end of October 2023 (its best first quarter since 2019), it’s had clients asking, “where are markets going from here?” to which we must humbly respond, “we don’t know because we can’t predict the future.”
This isn’t to say that our experience can’t guide our thinking. Like other investors and wealth managers, we look at metrics and data to understand what current conditions are like relative to other time periods.
For example, while the price-earnings ratio can be used for a single stock, it can also be used for a stock market index. The current price-earnings ratio of the S&P 500 is about 23x, which compares to a long-term average of just north of 15x.
That’s pretty high in historical terms.
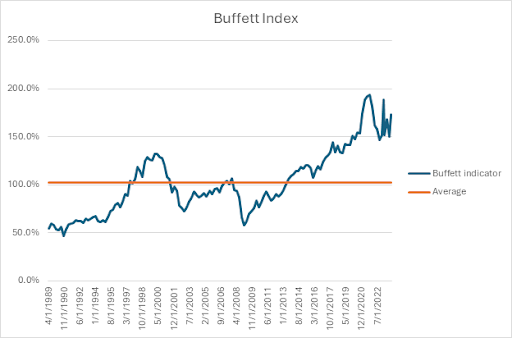
Another metric, the Buffett Indicator, created by the illustrious Warren Buffett, takes the value of all public US stocks (via the Wilshire 5000 index) and divides it by Gross Domestic Product. If the result of this fraction is greater than one, it means the stock market is overvalued. If the resulting fraction is less than one, the stock is undervalued. Simple enough, right? Today, the Buffett Indicator sits around 1.9, which is nearly as high as it’s ever been.
Indicators matter—but not in isolation
While one could use a high Buffett Indicator as a reason to justify selling most if not all risky assets in a portfolio, we believe making decisions about an investment portfolio requires considering many other factors.
Momentum (both upward and downward) is a feature of stock markets. This means that the stock market can be perceived by the Buffett Indicator as overvalued for long stretches of time.
But if someone sold their entire stock portfolio the last time the Buffett Indicator was below one—all the way back in July of 2013—they would have missed out on nearly 300 percent in stock market gains. No one wants that, right?
For most people, making investment decisions based on the Buffett Indicator isn’t an advisable portfolio strategy.
One could argue that U.S. businesses are more valuable than in the past and, therefore, deserve higher valuations than the average suggests. We can point to rising revenues, margins, and shareholder returns as evidence. This data suggests U.S. corporations might be more productive than they’ve ever been. How?
One reason might be the internet, which has been a boon to a large portion of the economy—and we might be on the precipice of another productivity leap with generative artificial intelligence.
What are these metrics really telling us?
Maybe the better way to view the Buffett Indicator is to view it with a trend line. If we do this, U.S. stocks are still a bit overvalued, but nowhere near the overvaluation levels indicated by that 1.9 headline number alone.
We prefer this conclusion as the headline valuation numbers are dominated by the largest companies and there are still pockets of relative value in the U.S. stock market. This is evidenced by small capitalization stocks trading near 20-year lows relative to the S&P 500 on a trailing price to earnings.
When headline valuation numbers are indicating overvalued levels, discipline becomes even more important. By discipline we mean placing even more scrutiny on the assumptions and reasons why certain positions and strategies are held within a portfolio.
Discipline also means holding to allocation position limits, which should be well-diversified by including alternative asset classes and cash for opportunities that may present themselves. The stock market is not on sale, but that does not mean there is reason to panic.
Related Posts

Why investors shouldn’t hide from market corrections
April 7, 20252026 EdgeRock Outlook
December 4, 2025Private credit is under scrutiny. Is it warranted?
April 6, 2026
The lifetime value of Roth conversions
August 26, 2024


About the Author
Related Posts
Going Global: Inside EdgeRock’s latest model update
March 4, 2025Why investors shouldn’t hide from market corrections
April 7, 2025

Read more Insights